Creating a Period Indicator Report using OpenMRS Reporting Module

In my GSoC project, mostly I’m working with the OpenMRS reporting module and the DHIS connector module. So I was able to learn about creating period indicator reports with dimensions using the Reporting Module recently.
The Reporting Module was designed to provide a feature-rich and user-friendly web interface for managing reports within OpenMRS.
Period indicator report is a type of report which can be used to aggregate groups of data with a specific time range. So i’ll briefly tell you how to create a simple period indicator report using the OpenMRS reporting module. For an example, let’s create a report to get Male and Female patients under 20 years.
First login to OpenMRS and go to the System Administration -> Advance Administration. There you can click the ‘Reporting’ button in the navigation bar to open the module. There you can see the available reports. To create reports, go to Report Administration. If you haven’t installed OpenMRS, you can use the demo server to try this out.

Then we need to create cohorts queries in order to aggregate data under given condition. It provides us cohort query templates, so it’s easy to create one according to our needs. To get patients under 20 years, we have to create an ‘Age Query’.

Similarly we need 2 more cohort queries (Gender Queries) to get Male and Female Patients separately.
Next we need to create dimensions. With dimensions, we can restrict the reports only to get Male patients from the selected query. So here I’m creating a Gender-wise dimension from Dimension Definitions.

Now everything is ready for the report. Go back to Report Administration and Click on ‘Period indicator report’. Give a name and description for the report. After saving it, first add the dimension (Gender-wise dimension) we created previously by clicking “Add Dimension”.

Then create an Indicator using the age cohort query.
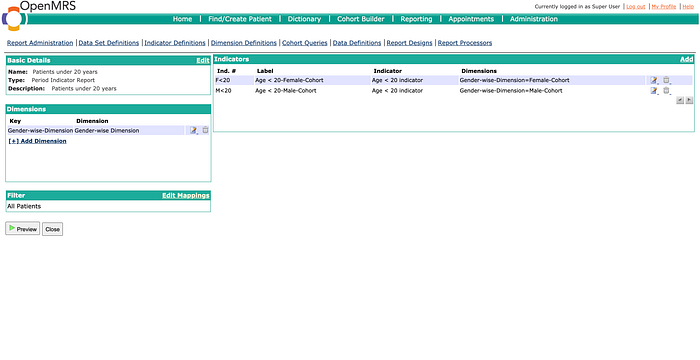
Final report details will look like this.
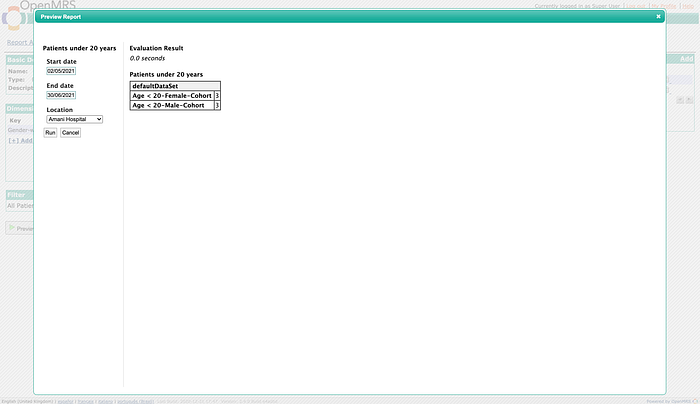
You can click preview option to test your report. And we have successfully created a period indicator report.
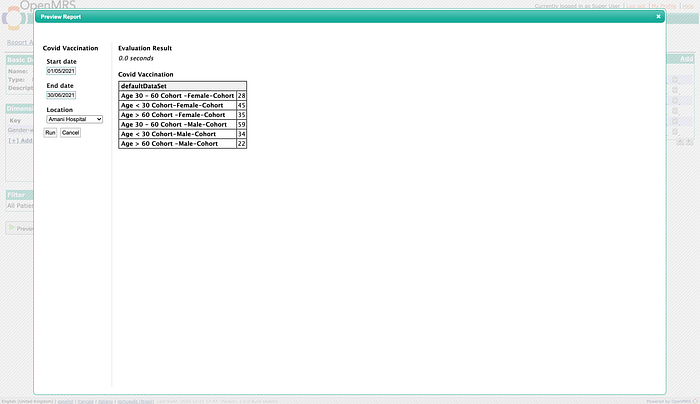
What we did was only a basic thing which can be done using the reporting module. It can be used to create larger reports with thousands of data. Here is another report I created as a sample report for my project.